3.2.3 Create a Dashboard
- From the Dashboard menu, you can also create new Dashboards. There are now three choices: New Dashboard, New Timeboard, and New Screenboard.
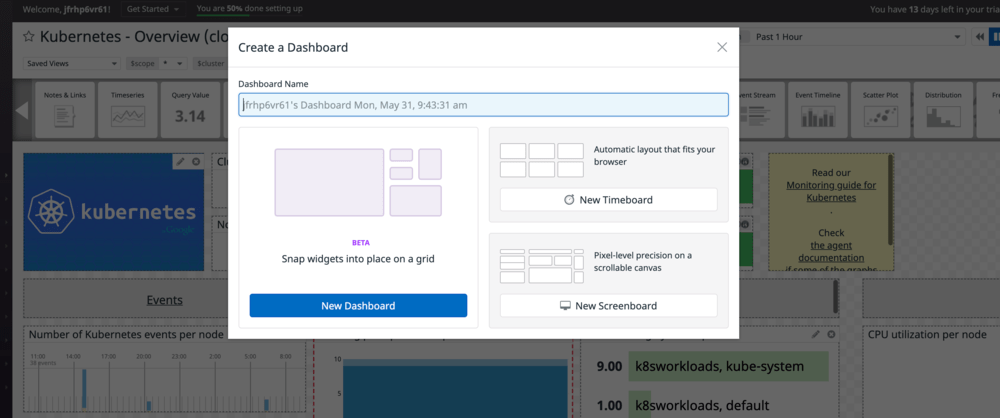 We have always had the last two, but we are merging the best features of each into the Dashboard. Enter a name for your dashboard and click the New Dashboard button.
- Scroll through the list of available widgets and then drag and drop the Timeseries onto the canvas.
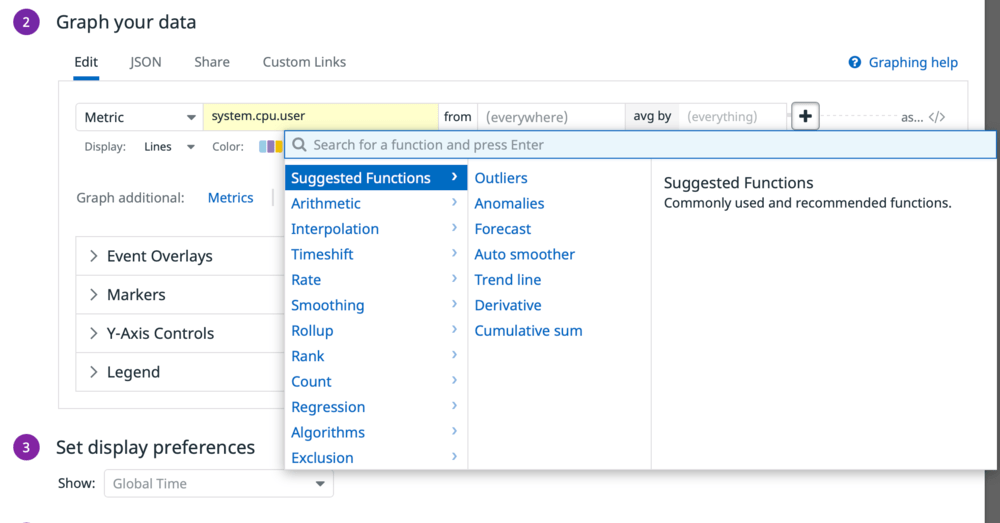
- Under Graph your data, click on Metric to see the other types of data that you can graph. Click on the metric, which defaults to system.cpu.user to see the list of all the metrics available. There are thousands of metrics available.
- Take a look at some of the other options available on this page. You can also combine multiple metrics using the Advanced… link.
- Click the Overview tab at the top. This is a nice way to preview some of the functions available, though there are many more on the main Edit tab when you click the plus button to the right of any metric.
- In the previous section we saw the Correlations view. When you click the Correlations tab here, you can customize how correlations are found.
- That’s a quick look at creating a dashboard. When you start working with Kubernetes, you will probably start with the dashboards provided and then gradually customize them and build your own. We have a complete course on Monitoring the Kubernetes Platform available on the Datadog Learning Center. Here are some of the key metrics you should consider keeping an eye on:
| etcd metric |
description |
| etcd.server.proposals.committed.total, etcd.server.proposals.applied.total, etcd.server.proposals.failed.total, etcd.server.proposals.pending |
Proposals occur when configuration changes are sent from the leader of the cluster to the other nodes in the cluster. Most should be successful, but errors are important to keep an eye on. |
| etcd.disk.wal.fsync.duration.seconds, etcd.disk.backend.commit.duration.seconds |
The etcd cluster sends proposals to each other via fsync, so disk performance is going to affect proposals. |
| etcd.debugging.mvcc.db.total.size.in_bytes |
Database size has a finite max and you need to make sure it always stays below that level. |
| etcd.grpc.server.msg.received.total, etcd.grpc.server.msg.sent.total, etcd.network.client.grpc.received.bytes.total, etcd.network.client.grpc.sent.bytes.total |
Network performance is going to affect the notifications of a proposals success to it’s important to watch that too. |
| apiserver metric |
description |
| kube_apiserver.rest_client_requests_total, kube_apiserver.rest_client_requests_total.count, kube_apiserver.rest_client_request_latency_seconds.sum, kube_apiserver.authenticated_user_requests, kube_apiserver.rest_client_request_latency_seconds.count, kube_apiserver.apiserver_request_count, kube_apiserver.apiserver_request_total, kube_apiserver.authenticated_user_requests.count, kube_apiserver.current_inflight_requests, kube_apiserver.apiserver_request_count.count, kube_apiserver.apiserver_request_total.count |
The apiserver is at its heart a webserver, so you need to monitor it like you would a webserver |
| docker.container.open_fds, the various docker.mem metrics, and kubernetes.cpu |
Again, it’s a webserver and these are some other metrics you would monitor with a webserver |
| controller manager and scheduler metrics |
description |
| kube_controller_manager.nodes.count, kube_controller_manager.nodes.unhealthy |
Making sure all the nodes are available and healthy is a good first step. |
| kube_controller_manager.queue.depth, kube_controller_manager.queue.retries |
The Controller and scheduler work off of a queue so making sure the queue depth isn’t getting too big is important. A large queue can point to other issues |
| kube_controller_manager.client.http.requests |
The controller also performs like a webserver |
| CoreDNS metrics |
Description |
| coredns.request_count |
Shows how many requests are coming into the DNS server. |
| coredns.cache_hits_count |
Divide this the request count to see the cache hit rate. A low hit rate may show that you should raise the TTL value |
| coredns.request_duration.seconds.sum, coredns.request_duration.seconds.count |
Understanding how long requests take to resolve is important |
| coredns.response_code_count |
When CoreDNS encounters an error, an RCODE is generated. This shows how many of each error is occurring |
Again, the course on Monitoring the Kubernetes Platform at https://learn.datadoghq.com goes into a lot of detail on this topic if you want to learn more.