AWS Modernization with Datadog > Use and Monitor the App on EC2 > Module 1.1: Use the Application > 1.1.2 Monitoring the Application
1.1.2 Monitoring the Application
- Open
app.datadoghq.comand login using the credentials from labs.datadoghq.com that you copied to your notes. - Under Infrastructure take a look at the Host Map. Each hexagon represents a single host or instance in our environment.
- Click on the hexagon that represents the database (db).
- Try clicking on the pill for postgres. Now we can see metrics for postgres on this instance.
- From the infrastructure menu, click Processes. We can now see the processes running in each of our instances.
- Click on any of the processes that you recognize and look around.
- Take a look at Network under Infrastructure. Here you can see the amount of network traffic traveling between our nodes.
- Finally take a look at the Network Map under Infrastructure. Now you can visualize those connections. Hover over each of the instances to see more detail.
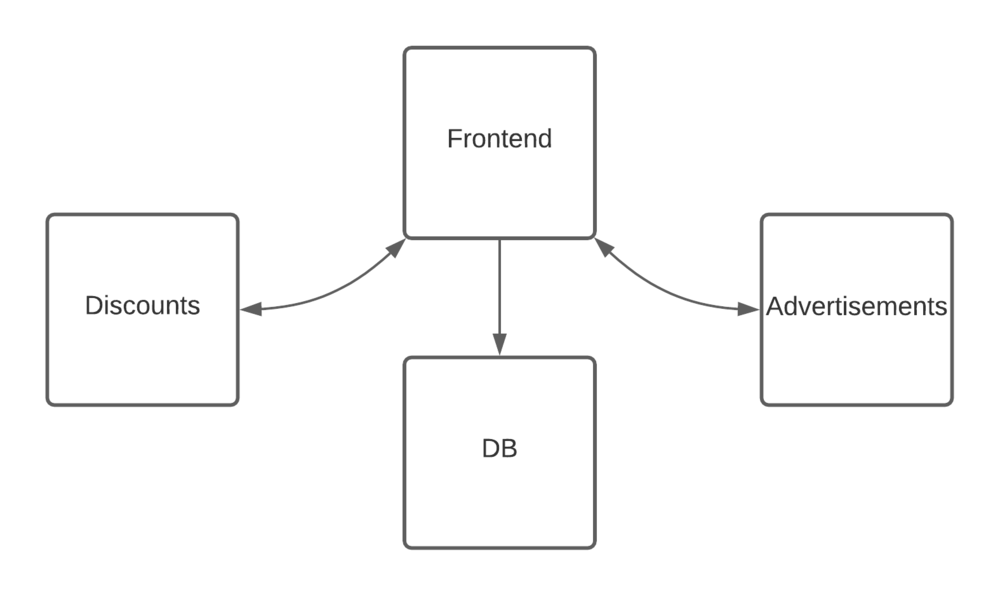
- Navigate to the Service Map under APM. If you don’t see anything here, you may need to wait a few minutes for data to start to appear here. You should see each of the services of the application and how they are linked to each other.
- Click on Store Frontend and choose to View the Service Overview. Scroll down the page and notice the different types of information available.
- Click on the Spree::HomeController endpoint. Click on one of the spans at the bottom of the page. You should see a flamegraph representing that particular request.
- Try the other options from the Service Map. Take a look at the other services on the map.