3.2.1 Reviewing the Containers view
In the previous section we used kubectl to dig in to our Kubernetes cluster. In this section we will use some of the tools in Datadog to do some of the same things, and then take it a bit further.
- Using the login information you collected during the prerequisites section, login to Datadog at https://app.datadoghq.com.
- Navigate to the Infrastructure > Containers view.
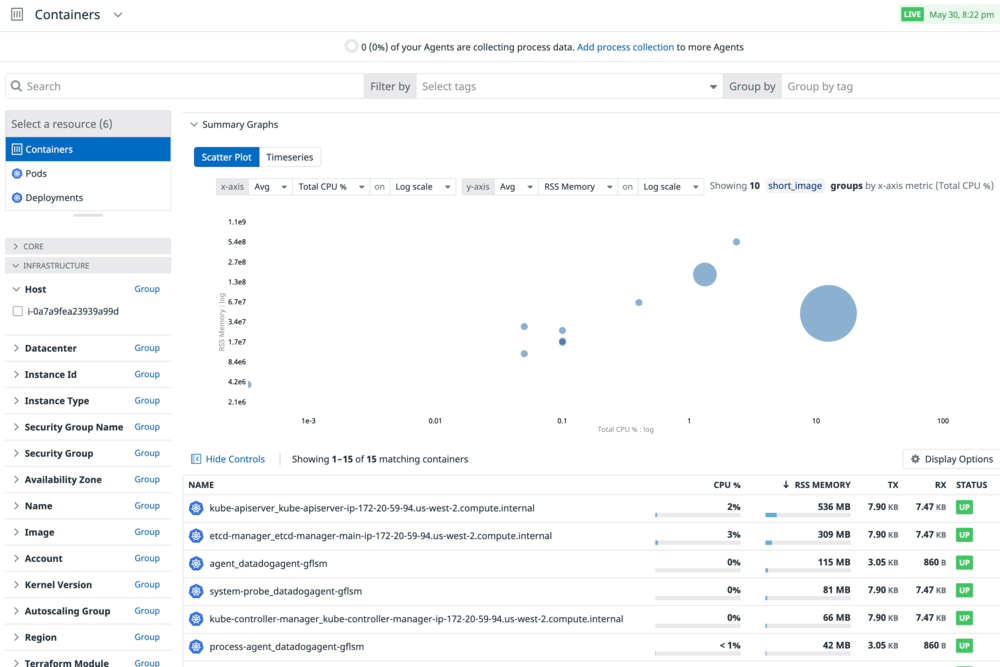 From this page you can see memory vs CPU of all the containers across your Kubernetes clusters and Docker on all platforms.
 - Click on one of the two containers for etcd-manager to see a small dashboard of that particular container.
- Next look at the logs for that container. If you don’t see anything, change the time period from Live Tail, which will show logs as they come in to Past 12 Hours. We don’t have APM enabled so nothing will show up there.
- Click the X at the top right and then change the Resource at the top left from Containers to Pods. Now we see a list of all the Pods that are being monitored right now.
- Click on any of them and you will see the YAML that describes that pod. This is not the YAML file that started the pod, but rather the current representation of it.
- You saw the Logs and Network tab before, but now we also have Processes showing each of the processes running in that Pod.
- Click on any process shown and you will open a page for that process. Note, this opens in a new tab so you never loose your place. Just close this tab when you are done.
- Notice that you can also switch to other resources: Deployments, Replica Sets, Services, and Nodes.
- Under Infrastructure, there are also dedicated views for all processes as well as network.